How Tone Controls REALLY WORK...!

Since 2005, many people have asked questions about Stellartone's charts, which compare the EQ curves of a standard tone pot vs an array of fixed capacitors. "Why do ToneStylers sound different than tone pots?" The internet is full of such questions... but usually the wrong answers! Here's the "true story".
To start... the most-popular criticism, "Those chart curves don't look like pickup outputs!"... is 100% true! This is because contrasting guitars, basses and pickups are electronically and tonally different. One EQ chart cannot possibly represent all instruments.
It's impractical to test hundreds of pickups and instruments, then publish contrasting EQ chart curves for each one, in a comprehensive booklet. Likewise, it would be of limited value to "average" the frequency response curves of hundreds of combinations of pickups, strings, chords played... plus the circuit's inductance, impedance, and DC resistance... plus the cable's capacitance, the amps & speaker cabinets, the microphones, etc. Such a hybrid chart might look nice... but it too would fail to represent real-world "pickup+tone control" EQ curves.
So, rather than choosing one popular guitar or bass as the sound source, or normalizing the huge sampling of possible sources, as described above... Stellartone used a pink noise generator!
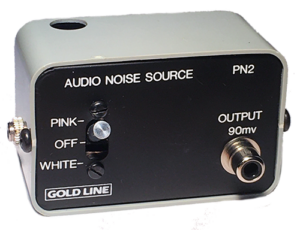
To create these tone control charts, the pink noise signal passes through the tone control or capacitor circuit being evaluated, and into a digital frequency spectrum analyzer:
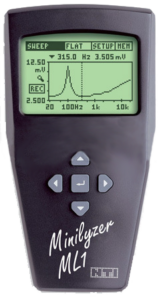
The digital & monochrome graphical output of the Minilyzer is then imported into Adobe Photoshop to produce the multi-color curves shown in our animated GIF charts.
The second-most popular internet criticism... that our enhanced color EQ charts are an "artist's rendering"... is also 100% true! However, the X-Y axes, data points, and EQ curves are 100% accurate - there's zero normalization, guesswork or opinion shown.
By virtue of the flat and wide frequency response of pink noise, the resulting smooth EQ curves lack the many peaks, valleys, spikes, notches, cut-offs and drop-outs, as produced in the real world of guitars, basses and audio equipment. If a source's irregular audio response was used, this would be reflected in a correspondingly-irregular tone control EQ curve... with what value? That ragged result would fail to display the smooth & uniform performance of tone capacitors.
Most importantly... pink noise is an actual audio signal, actually being measured! These charts are not simply a mathematical prediction of a virtual audio signal passing through virtual components, as generated by hobby programs such as "SPICE". There is no THEORY, FORMULAE or ASSUMPTION in this data. Stellartone's EQ charts are REAL... and 100% accurate.
Here's why popular "virtual EQ charts" have little value: if an actual capacitor produces a measurable -7dB per octave roll-off slope curve... but a computer program incorporates an untrue -5dB per octave roll-off slope curve, the theoretical tool will not provide any valid data. This coding defect is known as "garbage in... garbage out". When "virtual audio" software produces precisely the same EQ curves as physical capacitors, that will change.
The same problem is seen in various published efforts to analyze pickups and tone controls, via practical experimentation and measurements in the studio. While these exercises may be well-meaning, the results are typically incorrect, due to the inclusion of the many uncontrolled variables described above... or, simply due to "confirmation bias".
Some writers assert that magical capacitors exist, which shift the roll-off frequency when the tone pot is adjusted in resistance! Other writers believe that a 500kΩ tone pot "sounds different" if the resistive component is carbon-composition, vs cermet plastic. Such claims are easily refuted.
Two high-quality capacitors with identical measured capacitance values, but different dielectric materials (such as ceramic vs polyester), will produce electrically and sonically-identical roll-off curves... IDENTICAL. As proven in countless double-blind listening tests, one quality .022µF tone cap does not "sound better"... or even "sound different"... than another. The perception that an unprovable and unrepeatable tonal difference exists... is known as "magical thinking". Should you volunteer as a subject in such a listening test, prepare to be embarrassed... and educated! When a difference in electrical specifications cannot be quantified by any objective means, it cannot be qualified by any subjective means.
In summary, Stellartone's charts cannot show how a tone pot, or a tone capacitor, interacts with everything else in a guitar, bass, or amplifier. By eliminating the electrical and sonic variables produced in the real world... from guitar pick to speaker grille... these pink noise EQ charts solely display HOW TONE CONTROLS REALLY WORK... and that's all!
Copyright 2023 by Don Campbell & Stellartone